
How is employment evolving in Sweden – and does the answer look the same across regions, sectors, and genders?
Using official data from Statistics Sweden (SCB), this post explores the Swedish labor market through a data-driven lens. I analyze employment trends broken down by sex, region, and economic sector, visualize long-term patterns and seasonality, and apply SARIMA time-series models to forecast future employment levels.
The dataset consists of monthly employment figures from SCB, disaggregated by sex, region, and sector. Due to the hierarchical structure of the data, careful preprocessing was required to avoid double counting (e.g., totals vs subcategories).
1. Data cleaning and preparation
First, the employment data provided by Statistics Sweden (SCB) is published in a long (tidy) format, where each row represents a single observation defined by a combination of dimensions such as time, sex, region, sector, and observation type. This format is well suited for:
- Official statistics and databases
- Efficient storage of high-dimensional data
- Flexible filtering and aggregation across multiple categories
In other words, the long format makes it easy for SCB to extend the dataset with new dimensions (e.g. additional regions or sectors) without changing the underlying structure. However, for analytical tasks such as time-series modeling, comparisons across groups, and plotting, the long format is often not the most convenient representation.
For this reason, the data was transformed into a wide format. Another problem with the data is that, it contains both aggregate and disaggregated values (e.g., “All sectors” vs individual sectors). Therefore, I filtered the data to avoid redundancy before analysis.
2. Employment by Sex
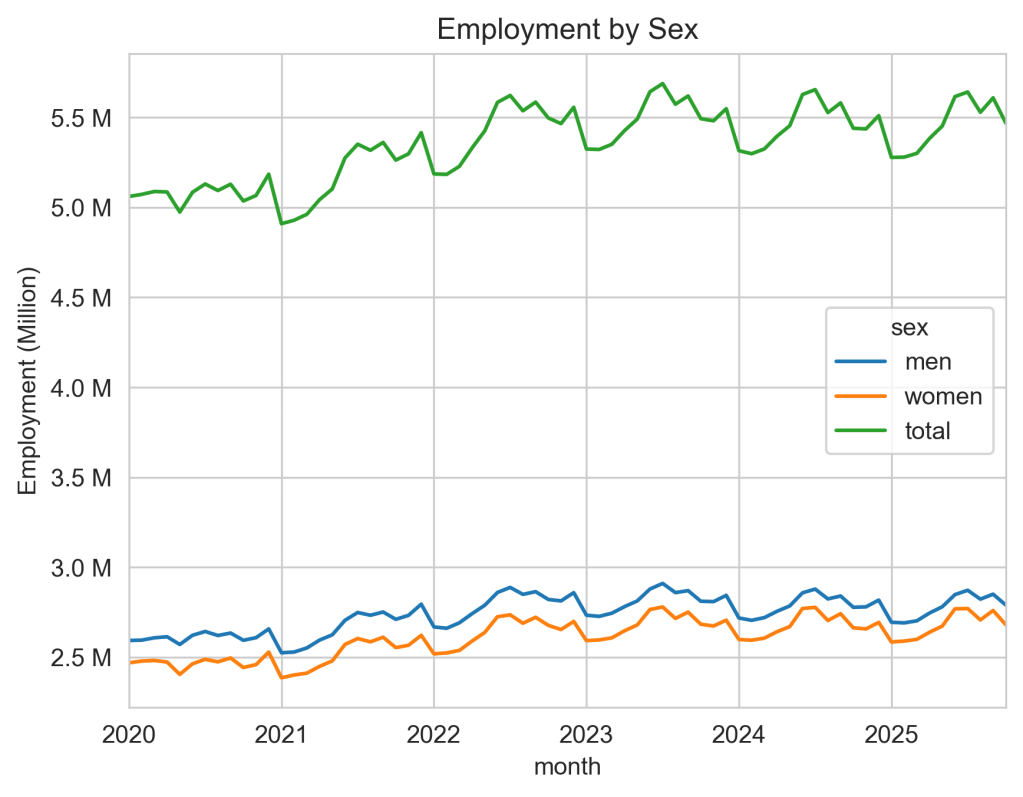
The data provides number of ongoing employment in Sweden in the period from 2020 January to 2025 October. In overall, the employment is slightly increasing and reaching 5.5M at this moment. Another interesting fact, it shows that more men are working in the labour market than women. I don’t have any deep explanation for this, but my guess it lies in the sex ratio of Sweden’s population. We also see the seasonal effect in the employment number in which the drop usually occurs in the summer and at the end of each year.
3. Employment by Sector
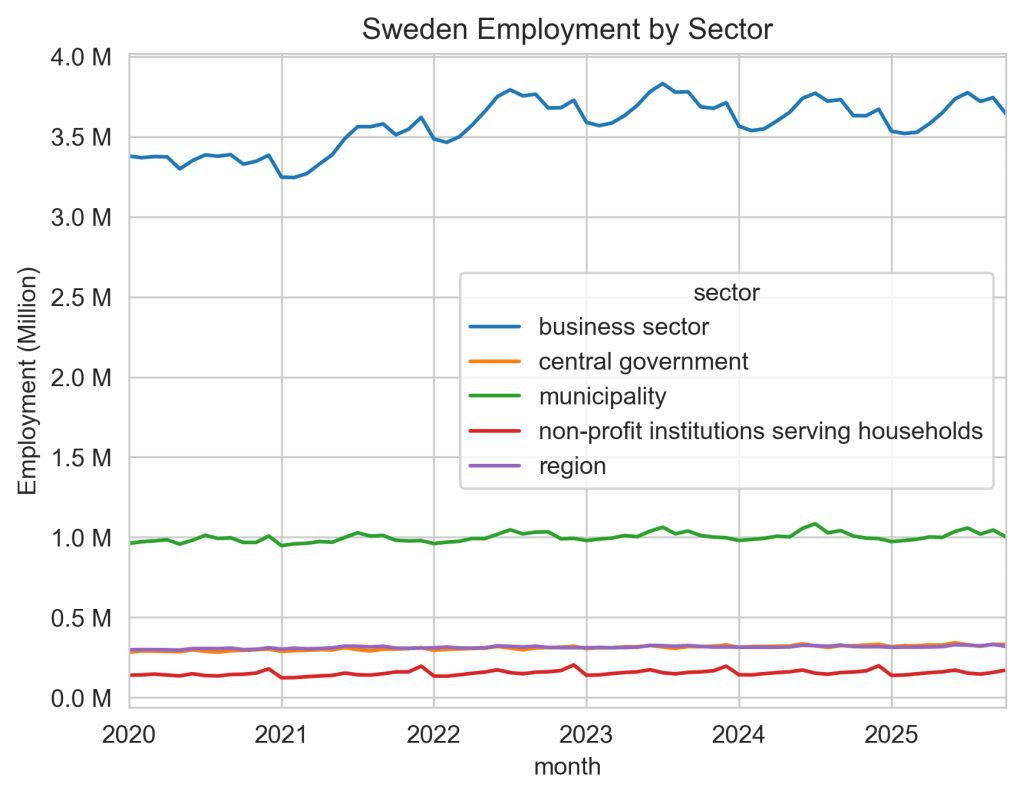

At first glance, the business sector dominates employment at roughly two-thirds of total jobs (~67%). The sector is highly cyclical and drives most of the short-term volatility in employment. On the other hand, the public sector (including central government, municipality and regional) accounts for ~30% in total and is stabilizing overtime.
4. Employment by Region
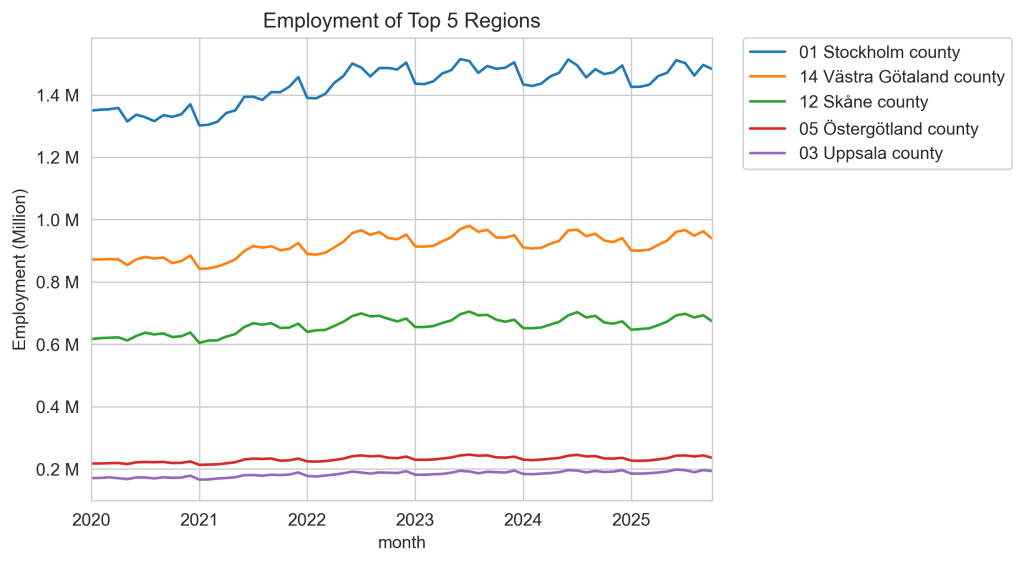
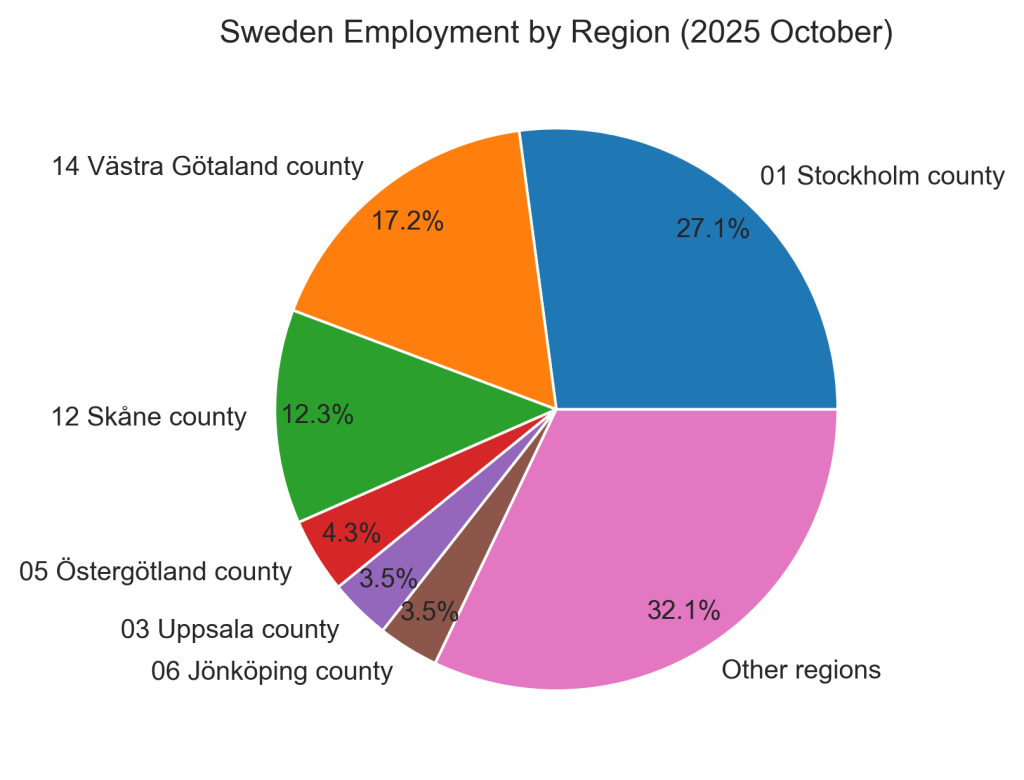
In terms of geographic distribution, employment in Sweden is highly concentrated in a small number of metropolitan regions, with Stockholm, Västra Götaland, and Skåne accounting for nearly 60% of total employment. While employment levels fluctuate over time, the regional distribution of jobs appears structurally stable, with no major reshuffling among the largest regions.
5. A Forecast
Given that two-thirds of employment is concentrated in the business sector — which is highly sensitive to economic cycles – modeling seasonality and persistence becomes particularly important. This motivates the use of SARIMA models, which are well suited to capturing both trend and recurring seasonal patterns in aggregate employment data
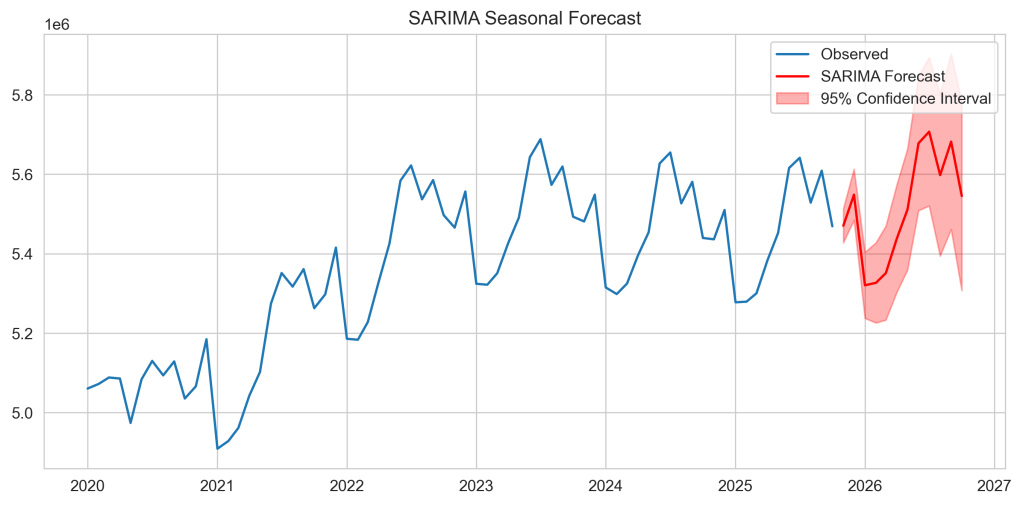
The most notable feature of the forecast is that it reproduces the familiar seasonal pattern observed in the historical data:
- Employment dips around the turn of the year
- It rises steadily through spring and summer
- Peaks again in the second half of the year
This indicates that the SARIMA model has successfully learned the annual seasonal structure of Swedish employment. The forecasted pattern in 2026 closely mirrors previous years rather than introducing new dynamics.
The SARIMA 2026 forecast is largely driven by recurring seasonal effects rather than a strong underlying trend.
As a univariate model, SARIMA does not capture explicit economic drivers (GDP, interest rates, migration), policy changes, structural breaks or sectoral reallocation. For the optimists (including me), however, the forecast shows no sharp acceleration or collapse in employment.
A natural extension of this analysis, which will be discussed in a later post, is to move from purely time-series models to machine learning-based forecasts (XGBoost / LSTM / SARIMAX). Such approaches require additional explanatory variables, including macroeconomic conditions (GDP, inflation, interest rates), labor market indicators (vacancies, wages, participation rates), demographic trends (population growth, migration, age structure), and policy-related factors (taxation, labor market regulation, public spending). Incorporating these features would allow the model to explain employment dynamics rather than simply extrapolating historical patterns.
